numpy.random.Generator.beta#
method
- random.Generator.beta(a, b, size=None)#
Draw samples from a Beta distribution.
The Beta distribution is a special case of the Dirichlet distribution, and is related to the Gamma distribution. It has the probability distribution function
\[f(x; a,b) = \frac{1}{B(\alpha, \beta)} x^{\alpha - 1} (1 - x)^{\beta - 1},\]where the normalization, B, is the beta function,
\[B(\alpha, \beta) = \int_0^1 t^{\alpha - 1} (1 - t)^{\beta - 1} dt.\]It is often seen in Bayesian inference and order statistics.
- Parameters:
- afloat or array_like of floats
Alpha, positive (>0).
- bfloat or array_like of floats
Beta, positive (>0).
- sizeint or tuple of ints, optional
Output shape. If the given shape is, e.g.,
(m, n, k), thenm * n * ksamples are drawn. If size isNone(default), a single value is returned ifaandbare both scalars. Otherwise,np.broadcast(a, b).sizesamples are drawn.
- Returns:
- outndarray or scalar
Drawn samples from the parameterized beta distribution.
References
[1]Wikipedia, “Beta distribution”, https://en.wikipedia.org/wiki/Beta_distribution
Examples
The beta distribution has mean a/(a+b). If
a == band both are > 1, the distribution is symmetric with mean 0.5.>>> rng = np.random.default_rng() >>> a, b, size = 2.0, 2.0, 10000 >>> sample = rng.beta(a=a, b=b, size=size) >>> np.mean(sample) 0.5047328775385895 # may vary
Otherwise the distribution is skewed left or right according to whether
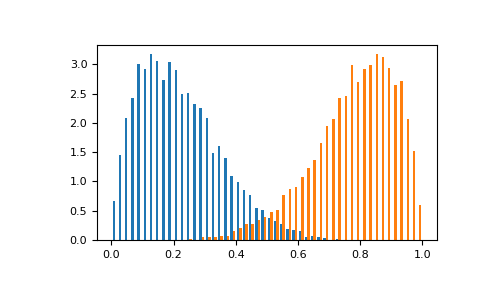
aorbis greater. The distribution is mirror symmetric. See for example:>>> a, b, size = 2, 7, 10000 >>> sample_left = rng.beta(a=a, b=b, size=size) >>> sample_right = rng.beta(a=b, b=a, size=size) >>> m_left, m_right = np.mean(sample_left), np.mean(sample_right) >>> print(m_left, m_right) 0.2238596793678923 0.7774613834041182 # may vary >>> print(m_left - a/(a+b)) 0.001637457145670096 # may vary >>> print(m_right - b/(a+b)) -0.0003163943736596009 # may vary
Display the histogram of the two samples:
>>> import matplotlib.pyplot as plt
>>> plt.hist([sample_left, sample_right],
...          50, density=True, histtype='bar')
>>> plt.show()