numpy.random.Generator.exponential#
method
- random.Generator.exponential(scale=1.0, size=None)#
Draw samples from an exponential distribution.
Its probability density function is
\[f(x; \frac{1}{\beta}) = \frac{1}{\beta} \exp(-\frac{x}{\beta}),\]for
x > 0and 0 elsewhere. \(\beta\) is the scale parameter, which is the inverse of the rate parameter \(\lambda = 1/\beta\). The rate parameter is an alternative, widely used parameterization of the exponential distribution [3].The exponential distribution is a continuous analogue of the geometric distribution. It describes many common situations, such as the size of raindrops measured over many rainstorms [1], or the time between page requests to Wikipedia [2].
- Parameters:
- scalefloat or array_like of floats
The scale parameter, \(\beta = 1/\lambda\). Must be non-negative.
- sizeint or tuple of ints, optional
Output shape. If the given shape is, e.g.,
(m, n, k), thenm * n * ksamples are drawn. If size isNone(default), a single value is returned ifscaleis a scalar. Otherwise,np.array(scale).sizesamples are drawn.
- Returns:
- outndarray or scalar
Drawn samples from the parameterized exponential distribution.
References
[1]Peyton Z. Peebles Jr., “Probability, Random Variables and Random Signal Principles”, 4th ed, 2001, p. 57.
[2]Wikipedia, “Poisson process”, https://en.wikipedia.org/wiki/Poisson_process
[3]Wikipedia, “Exponential distribution”, https://en.wikipedia.org/wiki/Exponential_distribution
Examples
Assume a company has 10000 customer support agents and the time between customer calls is exponentially distributed and that the average time between customer calls is 4 minutes.
>>> scale, size = 4, 10000
>>> rng = np.random.default_rng()
>>> time_between_calls = rng.exponential(scale=scale, size=size)
What is the probability that a customer will call in the next 4 to 5 minutes?
>>> x = ((time_between_calls < 5).sum())/size
>>> y = ((time_between_calls < 4).sum())/size
>>> x - y
0.08  # may vary
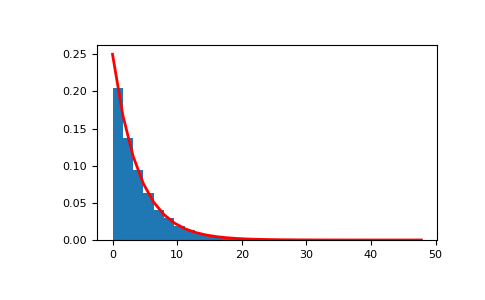
The corresponding distribution can be visualized as follows:
>>> import matplotlib.pyplot as plt
>>> scale, size = 4, 10000
>>> rng = np.random.default_rng()
>>> sample = rng.exponential(scale=scale, size=size)
>>> count, bins, _ = plt.hist(sample, 30, density=True)
>>> plt.plot(bins, scale**(-1)*np.exp(-scale**-1*bins), linewidth=2, color='r')
>>> plt.show()